


The Ethereum price is once again at a pivotal moment, hovering near a technical threshold that could determine its near-term trajectory. After weeks of consolidation and repeated rejection at key resistance levels, the second-largest cryptocurrency by market capitalization appears to be slipping into what analysts describe as a “danger zone.” This phase is typically characterized by weakening bullish momentum, declining trading volume, and heightened volatility — all of which increase the probability of a decisive breakdown.
Market participants are closely monitoring the current ETH price action, particularly as macroeconomic uncertainty and shifting investor sentiment add complexity to the broader crypto landscape. With Bitcoin showing signs of consolidation and altcoins struggling to maintain upward momentum, Ethereum’s technical posture has become increasingly fragile.
In this comprehensive analysis, we will explore why the Ethereum price is under pressure, identify crucial support and resistance levels, evaluate on-chain metrics, and assess what could happen next if the breakdown threat materializes. Whether you are a short-term trader or a long-term investor, understanding the current technical and fundamental setup is critical.
Ethereum Price Struggles Below Key Resistance
The recent decline in the Ethereum price did not occur in isolation. For several weeks, ETH has faced persistent selling pressure each time it attempted to reclaim higher levels. This repeated rejection has gradually eroded bullish confidence.
Repeated Rejection Signals Weak Momentum
When an asset consistently fails to break above resistance, it often indicates exhaustion among buyers. The Ethereum price attempted multiple rallies but was capped by strong supply zones. Each failed breakout attempt strengthened the resistance area, creating a ceiling that has proven difficult to penetrate.

Technically speaking, ETH has been trading within a narrowing range, forming what resembles a descending structure. Lower highs combined with flat or weakening support typically signal that sellers are gradually gaining control. This type of formation frequently precedes a downside move if buying pressure does not return.
Volume Decline Adds to Breakdown Risk
Another concerning factor is declining trading volume. Healthy uptrends are supported by expanding volume, confirming strong participation. However, recent ETH rallies have occurred on relatively muted volume, suggesting limited conviction.
If the Ethereum price breaks below its immediate support level while volume expands, it could confirm a bearish breakdown. Traders often interpret such a move as a signal to reduce exposure, potentially accelerating the decline.
Critical Support Levels Now Under Threat
Support levels represent zones where buyers historically step in to defend price. For Ethereum, the current support region has become the focal point of market attention.
The Immediate Support Zone
The Ethereum price is currently hovering near a support band that has previously acted as a demand area. This zone has successfully absorbed selling pressure in the past, leading to short-term rebounds. However, repeated tests of the same support weaken it over time. Each retest typically reduces the number of buyers willing to defend the level. If ETH closes decisively below this area, the technical structure may shift from neutral to bearish.
Psychological Levels and Market Sentiment
Beyond technical support, psychological price levels play a crucial role. Round-number thresholds often act as emotional anchors for traders. If the Ethereum price falls below a major psychological level, panic selling can intensify.
Sentiment indicators suggest growing caution. Funding rates on derivatives platforms have started to normalize, indicating reduced speculative enthusiasm. Meanwhile, open interest has shown signs of contraction, reflecting lower risk appetite.
Broader Crypto Market Influence
Ethereum rarely moves independently of the broader cryptocurrency ecosystem. The performance of Bitcoin and overall crypto market capitalization heavily influences ETH price action.
Bitcoin’s Consolidation Phase
Bitcoin’s sideways movement has contributed to uncertainty across altcoins. When BTC lacks clear direction, capital rotation into altcoins slows. The Ethereum price often struggles to sustain rallies in such conditions. If Bitcoin experiences a sharp correction, Ethereum could face amplified downside pressure due to its higher beta. Conversely, a strong Bitcoin breakout could provide the momentum needed to stabilize ETH.
Altcoin Market Weakness
The broader altcoin market has exhibited signs of fatigue. Several large-cap tokens have retraced gains, and speculative activity has cooled. This environment makes it challenging for the Ethereum price to mount a sustained recovery. Investors are increasingly selective, prioritizing assets with strong narratives or upcoming catalysts. Without a clear catalyst, ETH remains vulnerable to macro-driven volatility.
Technical Indicators Flash Warning Signs
Technical analysis provides additional context for evaluating the breakdown threat. Several indicators suggest caution.
Relative Strength Index (RSI) Trends Lower
The RSI on higher timeframes has been drifting downward, indicating weakening momentum. While not yet in oversold territory, the indicator shows that buying strength has diminished. If the Ethereum price continues to decline and RSI breaks below key thresholds, it could confirm bearish dominance. Momentum oscillators often precede price movements, making them critical tools for traders.
Moving Averages Near Bearish Crossover
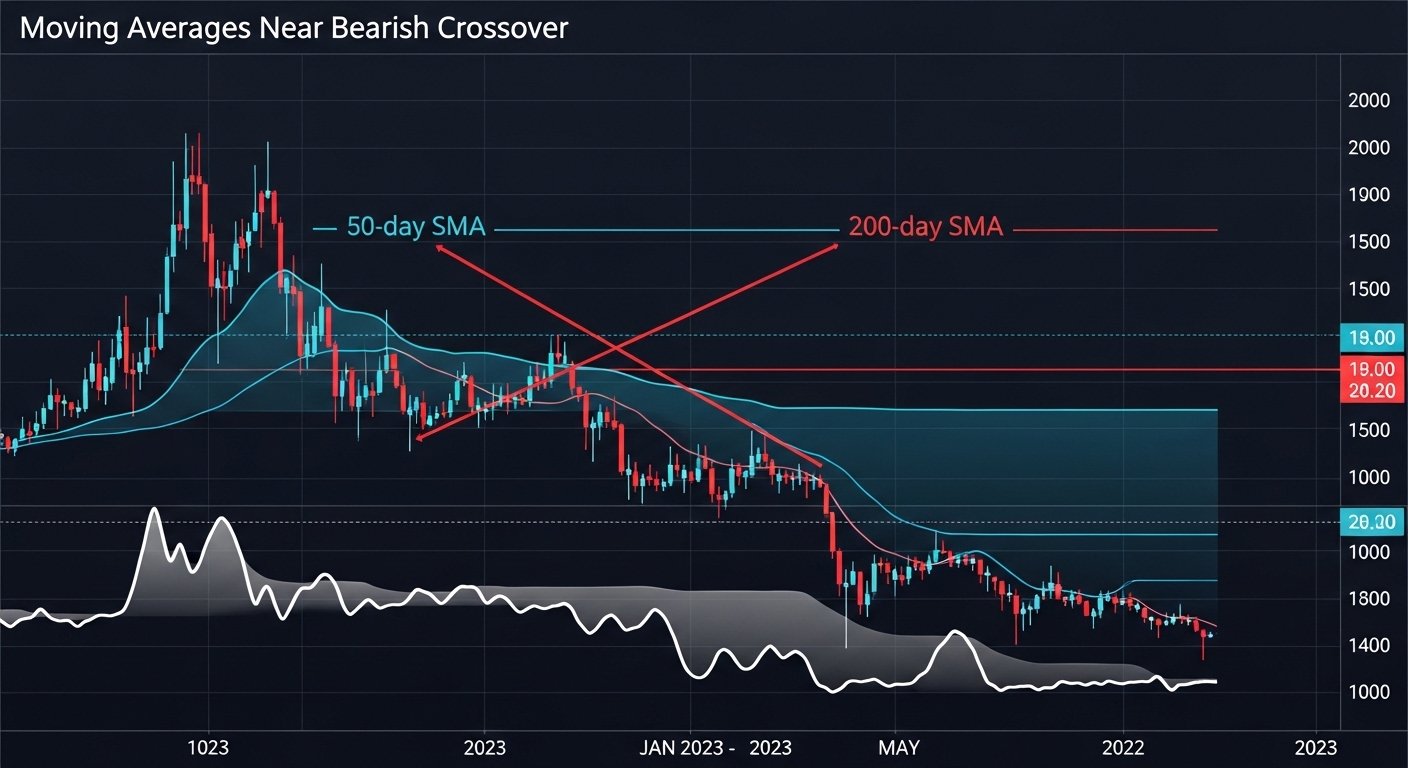
Short-term moving averages are approaching a potential bearish crossover beneath longer-term averages. Such crossovers are widely regarded as negative signals in trend analysis.If confirmed, this development could attract algorithmic selling and further pressure the Ethereum price. Market participants closely monitor these signals, particularly in volatile environments.
On-Chain Metrics and Network Activity
Beyond price charts, Ethereum’s on-chain fundamentals provide valuable insight into network health.
Declining Transaction Activity
Recent data suggests a modest slowdown in transaction growth. While Ethereum remains the dominant smart contract platform, reduced on-chain activity can influence short-term sentiment. A decline in active addresses or transaction volume may reinforce the perception that the Ethereum price is vulnerable. However, long-term fundamentals remain robust compared to many competing networks.
Staking Dynamics and Supply Pressure
Ethereum’s proof-of-stake model has locked a substantial portion of ETH supply. High staking participation reduces circulating supply, theoretically supporting price stability. Yet, if sentiment turns negative, even staked ETH can eventually be withdrawn and sold. Monitoring staking inflows and outflows is essential to gauge potential supply shocks affecting the Ethereum price.
Macro Environment and Risk Appetite
Global macroeconomic factors continue to influence digital asset markets. Interest rate expectations, inflation data, and regulatory developments all play a role.
Interest Rate Uncertainty
Higher interest rates generally reduce liquidity in risk assets. The Ethereum price, like other cryptocurrencies, is sensitive to shifts in monetary policy. If central banks maintain restrictive policies longer than expected, speculative capital may remain sidelined. Conversely, signals of easing could reignite demand for crypto assets.
Regulatory Developments
Regulatory clarity can either strengthen or undermine investor confidence. Any adverse regulatory announcement could amplify downside volatility in the Ethereum price. On the other hand, positive developments — such as ETF approvals or favorable legislation — could quickly reverse bearish momentum.
Potential Scenarios if Breakdown Occurs
If the current support fails, several outcomes are possible.
Scenario One: Accelerated Sell-Off
A decisive breakdown could trigger stop-loss cascades and liquidations in leveraged positions. This would likely drive the Ethereum price toward the next major support zone.In such a scenario, volatility would spike, and sentiment could turn sharply negative. Historically, breakdowns from tight consolidation patterns often result in swift price movements.
Scenario Two: False Breakdown and Recovery
Markets frequently produce false breakdowns to shake out weak hands. If ETH briefly dips below support but quickly reclaims it, a short squeeze could follow.This pattern would trap bearish traders and potentially fuel a relief rally in the Ethereum price. Traders should watch for strong volume and rapid recovery signals to identify this possibility.
Long-Term Outlook Remains Structurally Strong
Despite short-term risks, Ethereum’s long-term thesis remains intact.
Ecosystem Growth and Innovation
Ethereum continues to dominate decentralized finance, NFTs, and layer-2 scaling solutions. Network upgrades and ecosystem expansion strengthen its competitive position.While the Ethereum price may fluctuate, its role as foundational blockchain infrastructure remains significant.
Institutional Adoption
Institutional interest in Ethereum has grown steadily. Spot and derivatives products provide greater accessibility, and corporate adoption is increasing.Long-term investors often view dips in the Ethereum price as accumulation opportunities, provided fundamental metrics remain healthy.
Risk Management Strategies for Investors
Given the heightened breakdown risk, disciplined risk management is essential.
Position Sizing and Stop-Loss Placement
Traders should adjust position sizes according to volatility. Placing stop-loss orders below confirmed support levels can help mitigate downside exposure if the Ethereum price breaks lower.
Diversification and Portfolio Allocation
Diversifying across asset classes reduces concentrated risk. While Ethereum remains a core holding for many crypto portfolios, balanced allocation can protect against sudden drawdowns.
Conclusion
The Ethereum price is undeniably at a critical juncture. Technical weakness, declining momentum, and broader market uncertainty have combined to push ETH into a danger zone where a breakdown threat looms large. Key support levels are under intense scrutiny, and the coming sessions may determine whether Ethereum stabilizes or enters a deeper correction phase.
However, short-term vulnerability does not negate Ethereum’s long-term fundamentals. Network innovation, institutional participation, and ecosystem growth continue to provide structural support. For traders, vigilance and disciplined risk management are paramount. For long-term investors, patience and strategic positioning remain essential.As volatility increases, the market will soon reveal whether this danger zone marks the start of a significant downturn — or merely a temporary shakeout before the next upward move.
FAQs
Q: Why is the Ethereum price considered to be in a danger zone?
The Ethereum price is near a critical support level with weakening momentum and declining volume, increasing the probability of a technical breakdown.
Q: What happens if Ethereum breaks below support?
If ETH breaks below support with strong volume, it could trigger an accelerated sell-off toward lower demand zones.
Q: Can Ethereum recover after a breakdown?
Yes, false breakdowns are common in crypto markets. A rapid reclaim of lost support could lead to a strong rebound.
Q: How does Bitcoin influence Ethereum price movement?
Bitcoin often sets the overall market direction. If BTC declines sharply, the Ethereum price typically follows due to correlated trading behavior.
Q: Is Ethereum still a good long-term investment?
Despite short-term volatility, Ethereum’s strong ecosystem, staking model, and institutional adoption support a positive long-term outlook.